Stories from the Field

Stories Filters
Displaying 89 stories
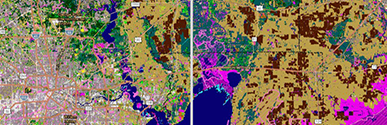
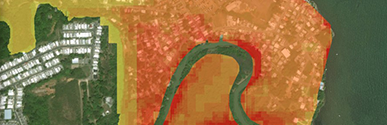
Analyzing Future Urban Growth and Flood Risk in North Carolina
Planners used NOAA regional land cover data to understand trends in development and predict future flood risk.
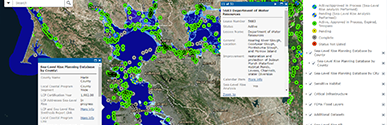
Analyzing Potential Aquaculture Opportunity Areas in Federal Waters off Southern California and the Gulf of America
Data from MarineCadastre.gov and OceanReports were used to evaluate small, defined geographic areas to determine their potential suitability for commercial aquaculture.
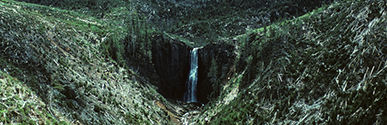
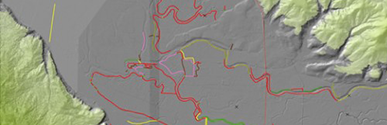
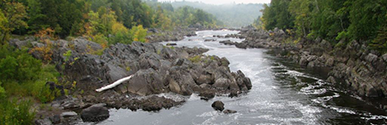
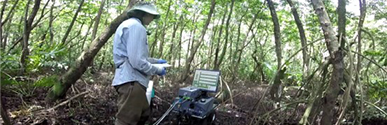
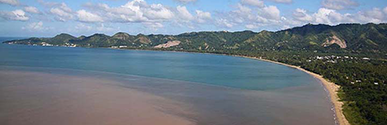
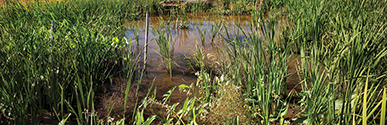
Analyzing Sedimentation Processes to Guide Conservation in Oregon
C-CAP data helped in the development of a conservation plan for the Yaquina watershed.

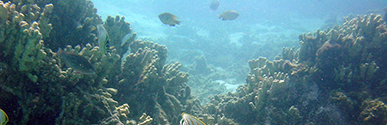
Applying Green Infrastructure to Stem Runoff and Safeguard Corals in Puerto Rico
Using OpenNSPECT, managers in Puerto Rico assessed whether green infrastructure would help lessen sediment and runoff into coral-inhabited waters. (Disponible en español.)

Applying Ocean Economy Data in Monmouth University Class in New Jersey
Monmouth University class uses ocean economy and sea level rise data to teach students about the economic benefits of the ocean, and the implications of human use.
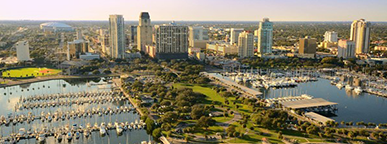
Applying the Marine Economy Framework to Inform the Economic Value of the Tampa Bay Estuary System
Partners conducted an economic impact analysis of the Tampa Bay estuary system to emphasize the value of the bay’s natural resources.
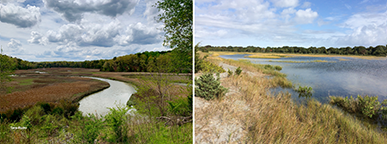
Assessing Tidal Marshes to Rank Resilience
The National Estuarine Research Reserve System used land cover data to rank marsh resilience and inform future restoration and conservation planning.
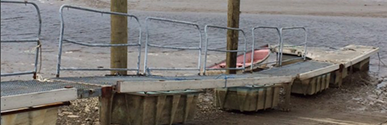
Assessing the Economic Significance of a Public Pier and Boat Launch in Maine
An analysis of the economic benefits of the Milbridge public pier and boat launch helps the community and local industries justify spending to remedy the effects of rapid sedimentation.
Assessing the Environmental Health of Streams in Washington
C-CAP land cover data helped determine the impact of development changes on stream health.
Assessing the Value of Nature’s Benefits in the St. Louis River Watershed
Researchers used land cover and change data for an ecosystem services valuation of the natural landscape.
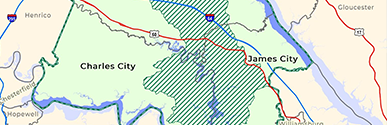
Assessing the Vulnerability of Transportation Infrastructure on the Eastern Shore
NOAA Sea Level Rise and Coastal Flooding Impacts data helped perform an inundation vulnerability assessment in Virginia.
Boosting Community Storm Resilience in Alaska
A Digital Coast Fellow helped Alaska communities address flooding with new data and a visualization tool.
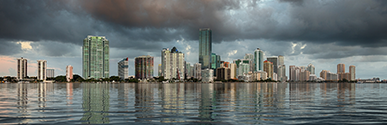
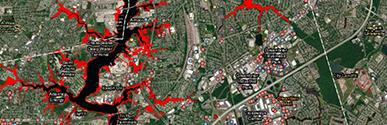
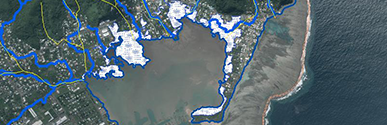
Building Awareness of Coastal Flood Risks in South Florida
Coastal Flood Exposure Mapper was used in South Florida to communicate coastal flooding and climate risks to residents.

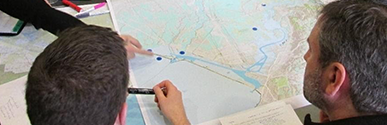
Building Capacity for Identifying Hazard and Climate Vulnerabilities in Florida
Florida regional planning councils build local and regional capacity for identifying hazard and climate vulnerabilities to better inform local planning efforts.
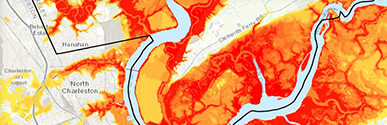
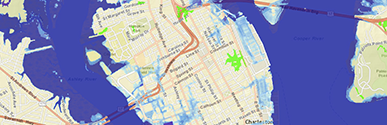
Building Community Awareness of Coastal Flood Risks in the Charleston Region of South Carolina
Coastal Flood Exposure Mapper was used to communicate coastal flooding and climate risks to residents.
Building Skills for Future Flood Hazard Preparedness in Puerto Rico
Coastal Inundation Mapping training provided partners with skills needed to recover from, and plan and prepare for, flood hazards. (Disponible en español.)
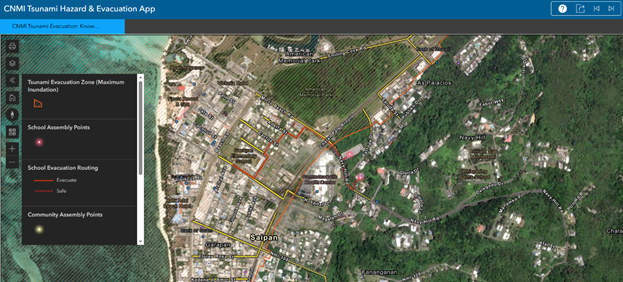
Building Tsunami Preparedness in the Commonwealth of the Northern Mariana Islands Using Lidar
Partners used NOAA lidar to revise tsunami hazard zones and develop evacuation maps.
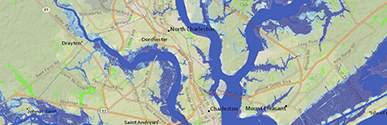
Building the Case for a Comprehensive Sea Level Rise Strategy in Charleston, South Carolina
The Sea Level Rise Viewer and a NOAA resilience grant enabled partners in this port city to picture sea level rise risks and strengthen their resilience and recovery plans over the next fifty years.
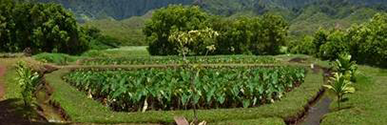
Capturing Traditional Knowledge to Inform Restoration Planning in Hawai`i
Participatory mapping incorporates traditional knowledge into coastal planning and restoration.
Creating a Comprehensive Plan for Resilient Salt Marshes in New Hampshire
High-resolution mapping data inform critical salt marsh monitoring, modeling, and management planning in New Hampshire.
Creating a Custom Tool to Visualize Impacts of Sea Level Rise in South Carolina
South Carolina Aquarium created an application based on the Sea Level Rise Viewer that allows the public to visualize the potential direct impacts of sea level rise and flooding.
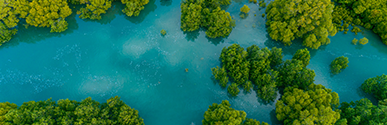
Determining the Effects of Urbanization on Carbon Sequestration in Mangroves in Puerto Rico
Researchers used C-CAP high-resolution land cover data to characterize the land adjacent to mangroves under study for carbon sequestration. (Disponible en español.)
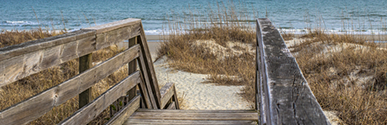
Determining the Source of Dune Erosion in South Carolina
C-CAP land cover data were used to examine the impervious surfaces adjacent to watersheds and determine the cause of dune erosion.

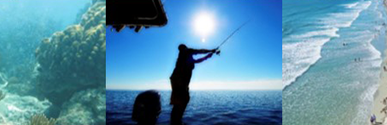
Developing an Economic Baseline for Recreation and Tourism on the Atlantic Coast
Researchers used Economics: National Ocean Watch (ENOW) data from the Ocean Jobs Snapshot to develop baseline economic profiles for 70 East Coast communities vulnerable to tourism and recreation impacts from offshore wind facilities.
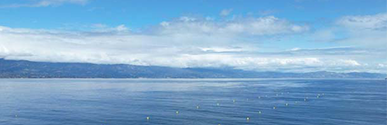
Driving Innovation in the New Blue Economy through Government-Industry Collaborations in Southern California
Ocean Rainforest and the Department of Energy collaborated with NOAA to use MarineCadastre.gov data to suitably site a pioneering aquaculture pilot operation.

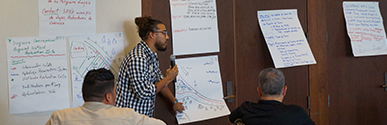
Engaging Communities in New Hampshire to Strengthen Resilience
New Hampshire communities used the Roadmap for Adapting to Coastal Risk to assess and address vulnerabilities and work toward reducing risk.

Enhancing Communication and Coordination in Wisconsin and Minnesota
Partners used the Seven Best Practices for Risk Communication training to create communities of practice, which led to stronger relationships, expanded resources, and shared insights.

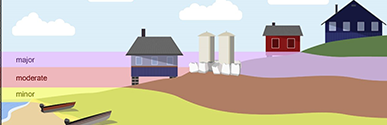
Estimating Flood Probability in Wisconsin
To determine flood probabilities, partners used NOAA’s Lake Level Viewer to identify the water level elevation at which flooding would occur for a Wisconsin community.

Estimating the Economic Contribution of Gloucester, Massachusetts’ Working Waterfront
Harbor planners used ENOW data to tailor their maritime economy profile and identify ocean-related businesses at a city level.
Evaluating Coastal and Nearshore Habitat Projects and Data Needs in the Great Lakes
Great Lakes coastal zone management programs brought together partners to identify and evaluate potential habitat projects, along with data needs and gaps, through a series of workshops.

Evaluating Land Loss from Sea Level Rise along the Atlantic Coast
Land cover change data and technical assistance from C-CAP were provided for the EPA’s Climate Change Indicators in the United States report.
Evaluating Restoration Effectiveness to Reduce Runoff and Protect Corals in Puerto Rico
Watershed managers in Puerto Rico used OpenNSPECT to evaluate how effectively hydroseeding restores highly erodible lands to protect corals. (Disponible en español.)
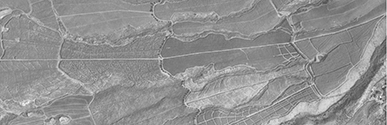
Examining Historical Imagery to Identify Sediment Sources in Maui
Pacific Historic Aerial Imagery from NOAA’s Office for Coastal Management helped identify sedimentation sources in Maui.

Examining Sediment Transport Following a Hurricane in Florida
Researchers used lidar data to examine sediment migration on North Captiva Island following large-scale erosion from Hurricane Charley.
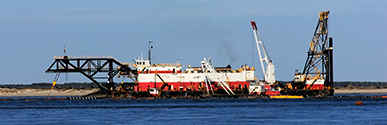
Facilitating Scientific Feedback on Dredging Impacts off the North Carolina Shore
OceanReports was used to help scientists and academics understand the ocean neighborhood of Frying Pan Shoals.
Fortifying Florida's Blue Economy
Florida Ocean Alliance developed strategies to help strengthen the state’s blue economy.
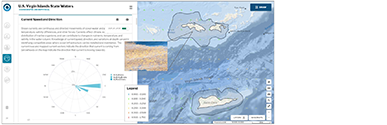
Harnessing the Power of Macroalgae in the Caribbean
OceanReports wind and water current layers were used to better predict seasonal locations of algal biomass for mariculture that does not require traditional infrastructure and gear.
Helping Minnesota Residents Understand Local Flooding Issues and Potential Solutions
A community open house helped local constituents understand flood-related impacts and costs as well as how to implement green infrastructure techniques to reduce those impacts.
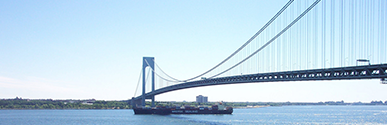
Identifying Energy Infrastructure at Risk Because of Sea Level Rise
The Sea Level Rise Viewer helped in identifying major metropolitan energy infrastructure at risk from climate change and sea level rise.
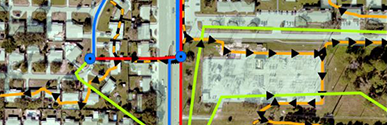
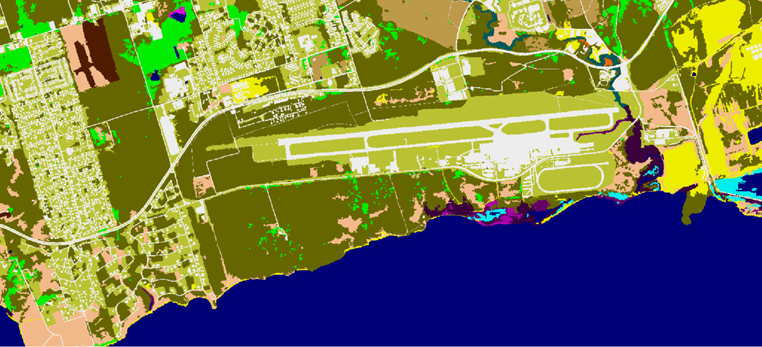
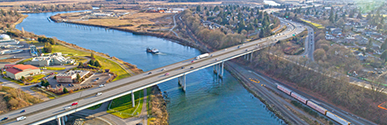
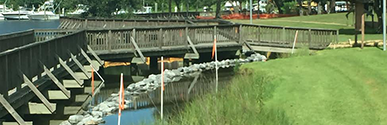
Identifying Flood Risks to Transportation Infrastructure in Texas
NOAA’s high-resolution land cover data was integrated with elevation data and flood modeling layers in Texas. This effort made it possible to analyze bridges in a variety of flood scenarios, and several were identified as potentially at risk from future flooding scenarios.

Identifying Future Flood Risks to Bank Infrastructure in the Southeast
A major U.S. bank used NOAA’s Sea Level Rise Viewer to investigate potential future flood impacts to its banking locations across the Southeast.
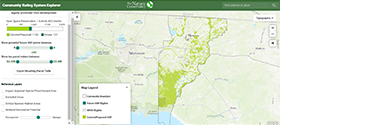
Identifying Open Space to Improve Resilience and Earn Community Rating System Credit in Gulf of America Communities
Partners worked with three Gulf communities to identify opportunities for preserving open space as part of the National Flood Insurance Program’s Community Rating System.
Identifying Sources of Pollution That Impact Coral Reef Communities in the Virgin Islands
C-CAP high-resolution land cover data helped identify watersheds where human land-use activity contributes to sediment and contaminants that impact coral reefs.
Identifying Vulnerability Hotspots for Florida's Hurricane Response Hub
Florida’s emergency responders and public health workforce explore data about the community to understand health and social equity implications of sea level rise and coastal flooding.
Identifying Watershed Stressors along Minnesota’s North Shore
Researchers and land managers utilized NOAA land cover data to identify watershed stressors along Minnesota’s North Shore streams.
Identifying a Flood-Safe Location for a Future Wastewater Treatment Facility in Mississippi
Mississippi’s Jackson County Utility Authority used the Sea Level Rise Viewer to identify a safe location for a new wastewater treatment facility.

Illustrating the Importance of Critical Infrastructure Data for Louisiana Coastal Parishes
The Coastal County Snapshots – Flood Exposure tool illustrates the importance of updating critical infrastructure maps for coastal parishes in Louisiana.
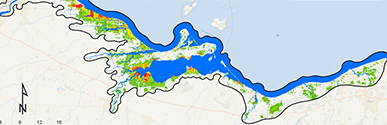
Improved Storm Surge Modeling Enhances Disaster Preparedness in the Caribbean
Expanding the availability of high-resolution land cover data in storm-prone regions is contributing significantly to better preparedness measures.
Improving Stormwater Runoff Modeling in Washington
C-CAP land cover data were used to analyze local stream flow and drainage issues.

Increasing Resilience in the San Francisco Bay Area through the Adapting to Rise Tides Program
Lidar data, the Sea Level Rise Viewer, and other Digital Coast resources address the specific challenges of building climate resilience across diverse communities, assets, services, and jurisdictions.
Informing Bird Habitat Conservation Decisions in Texas
Partners used land cover and sea level rise data to help inform decisions on bird habitat conservation.
Informing Future Flood Hazard Planning in Puerto Rico
High-resolution flood data incorporated into the Coastal Flood Exposure Mapper helps inform planning decisions. (Disponible en español.)
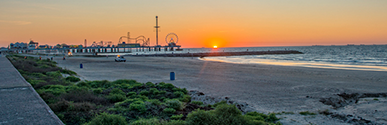
Inspiring Citizens to Protect and Preserve Galveston Bay in Texas
C-CAP data were used to assess wetland health for the Galveston Bay Report Card.
Leveraging Partnerships to Assess Damage and Recovery of Mangroves in Puerto Rico and Florida
Social Science Basics training and resources helped identify partners to help assess mangroves damaged during the 2017 hurricane season. (Disponible en español.)
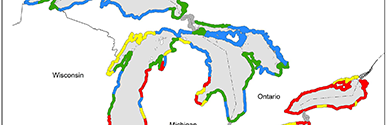
Locating and Assessing Western Lake Erie's Restorable Wetlands
C-CAP data were used to develop a decision-support framework and geospatial toolbox to prioritize wetland restoration efforts.
Mapping Ecosystem Services and Economic Data to Inform Restoration Priorities in the Great Lakes
ENOW helped researchers analyze the spatial overlap of ecosystem services, environmental stressors, and human uses to guide prioritization in project planning.
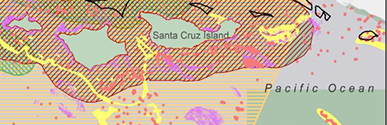
Modeling 3D Elevation to Inform Restoration and Adaptation Steps in California
The data collection and adaptation model help identify promising eelgrass restoration sites that could lessen future harm from sea level rise and habitat shifts.
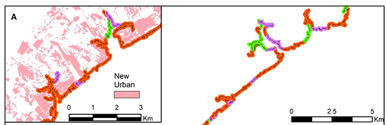
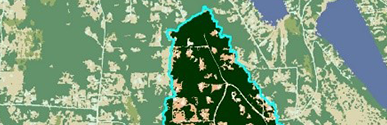
Modeling Future Development for Eastern North Carolina
C-CAP and lidar data were used to model potential future growth and land cover change.
Modeling Shoreline Suitability for Applying Nature-Based Infrastructure in Maine
Shoreline suitability models helped identify potentially successful locations for nature-based infrastructure in Casco Bay, Maine.
Modeling Storm Surge on the U.S. Territorial Island of Guam
Specialists at NOAA’s National Hurricane Center use the Historical Hurricane Tracks tool to analyze climatology efficiently and apply it to model storm surge.
Planning for Future Flood Hazards in Mississippi
The City of Ocean Springs used the Sea Level Rise Viewer to engage residents in land-use planning decisions to mitigate future flood hazards.
Planning for Resilience in Communities with Water-Dependent Uses and Working Waterfronts
A guide helps communities identify and prepare for coastal hazards that might impact their water-dependent businesses.
Planning for Resilient Coastal Communities in New York
The Coastal Inundation Mapping training, Roadmap for Adapting to Coastal Risk approach, and other NOAA resources aided New York partners in mapping and assessing Post-Tropical Cyclone Sandy impacts and planning for long-term recovery and resilience.
Preparing for Future Coastal Hazards Using Green Infrastructure in Puerto Rico
Communities in Puerto Rico learn green infrastructure techniques for enhancing resilience to hazards. (Disponible en español.)
Prioritizing Wetland Restoration Efforts in Wisconsin
OpenNSPECT helped identify potentially restorable wetlands in an effort to manage and control nonpoint source pollution.
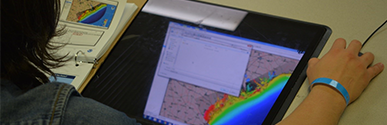
Producing Hydrography Data from Lidar for American Samoa
American Samoa can better manage and monitor water quality and other issues with high-resolution hydrographic data derived from Digital Coast lidar data.
Promoting Ecotourism to Conserve a Watershed in Virginia
Planners used methods learned in the Social Science Basics for Coastal Management training to help engage partners and promote ecotourism and land conservation.
Protecting Hawaiian Corals by Prioritizing Land Conservation Efforts
C-CAP data and OpenNSPECT were used to identify erosion prone-areas on Lana‘i Island.

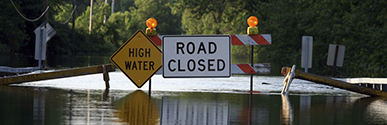
Providing Better Flood Estimates for Roadways and Bridges in New Jersey
Researchers used lidar data from NOAA’s Data Access Viewer to develop better estimates for when high water might flood roads and bridges.

Providing Climate Education Aids for a Changing Chesapeake Bay
Teachers used Digital Coast resources to educate local students on climate change
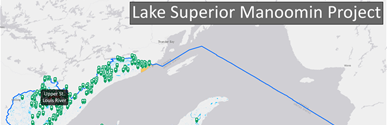
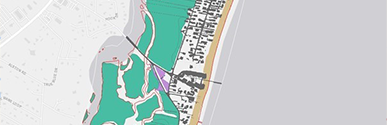
Restoring and Monitoring Lake Superior Coastal Wetland Manoomin
Organizations are working together with tribal communities to encourage the exchange of knowledge about and restoration of wild rice (manoomin).

Sharing Green Infrastructure Solutions with Residents and Business Owners in Ohio
A task force helped local constituents share ideas on flood reduction, visualize how to reduce flood-related impacts, and create a plan to implement green infrastructure.
South Carolina Community Lowers Flood Insurance Premiums Using NOAA’s Land Cover Data
The Town of Pawleys Island used high-resolution land cover data to map impervious cover and protected open space in the floodplain, earning the community a 25 percent discount on federal flood insurance premiums.
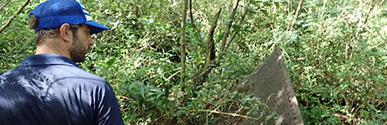
Surveying Historic Sites Using Lidar in the Commonwealth of the Northern Mariana Islands
NOAA lidar was used to map overgrown sites of historic significance and delineate a formal boundary for adoption as a National Historic Landmark.

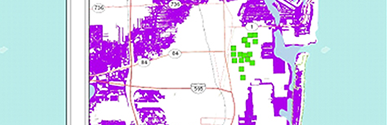
Tracking New Jersey’s Impervious Surface Changes Over Time
The New Jersey Department of Environmental Protection used NOAA’s high-resolution land cover data to fill gaps in impervious surface mapping.
Understanding and Planning for Sea Level Rise In California
California developed its own version of the Sea Level Rise Viewer to plan with sea level rise in mind.
Understanding the Present by Studying the Past through Lidar in American Samoa
Lidar data modeling reveals clues about how American Samoan culture responded to environmental change and managed its resources over the past 2,700 years.

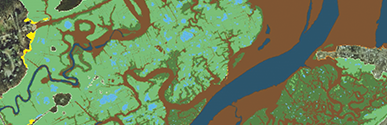
Using Automated Methods to Update the National Wetland Inventory in Louisiana
Scientists used NOAA’s high-resolution land cover data to develop a cost-effective approach to keeping this geospatial dataset accurate and up-to-date.
Using Green Infrastructure to Reduce Coastal Hazard Impacts in Alaska
Alaska communities are beginning to use green infrastructure to build community resilience.

Using High-Resolution Impervious Surface Mapping for Florida’s Statewide Flood Vulnerability Assessment
Partners used NOAA’s high-resolution land cover data to improve the state’s flood risk models.