The NOAA Office for Coastal Management acknowledges the many organizations that helped guide the development of this tool.
The USGS CoNED Applications Project provided the base elevation data used to map Louisiana via their Topobathymetric Elevation Model of the Northern Gulf of America.
The University of Hawaii School of Ocean and Earth Science and Technology through the NOAA Coastal Storms Program performed the mapping for Guam, the Commonwealth of the Northern Mariana Islands, and Hawaii.
The U.S. Geological Survey collaborated with the Office for Coastal Management on the development of two previous sea level rise mapping tools, one in Wilmington, Delaware, and one in Mississippi and Alabama. The lessons learned from these pilots led to the enhancement of the mapping methods and visual display used in this tool.
The Delaware Coastal Management Program provided content and feedback in the development of the first of the pilots.
State Sea Grant programs―specifically Mississippi-Alabama, Texas, North Carolina, and South Carolina―provided valuable feedback on the development of the second pilot, content on the explanation of sea level rise, and grants for developing and providing Social Vulnerability Index data.
Attendees of the Sea Level Rise and Inundation Community Workshop, Landsdowne, Virginia, December 3-5, 2009.
Culver, M. E., J. R. Schubel, M.A. Davidson, J. Haines, and K.C. Texeira (editors). 2010. Proceedings from the Sea Level Rise and Inundation Community Workshop, Lansdowne, Virginia, December 3-5, 2009. Sponsored by the National Oceanic and Atmospheric Administration and U.S. Geological Survey.
The University of South Carolina Hazards and Vulnerability Research Institute for providing Social Vulnerability Index data.
The Bureau of Labor Statistics for providing the block group analysis of the Quarterly Census of Employment and Wages.
The North Carolina Sea Level Rise study team for providing a good forum for discussion of new sea-level-rise risk assessment techniques.
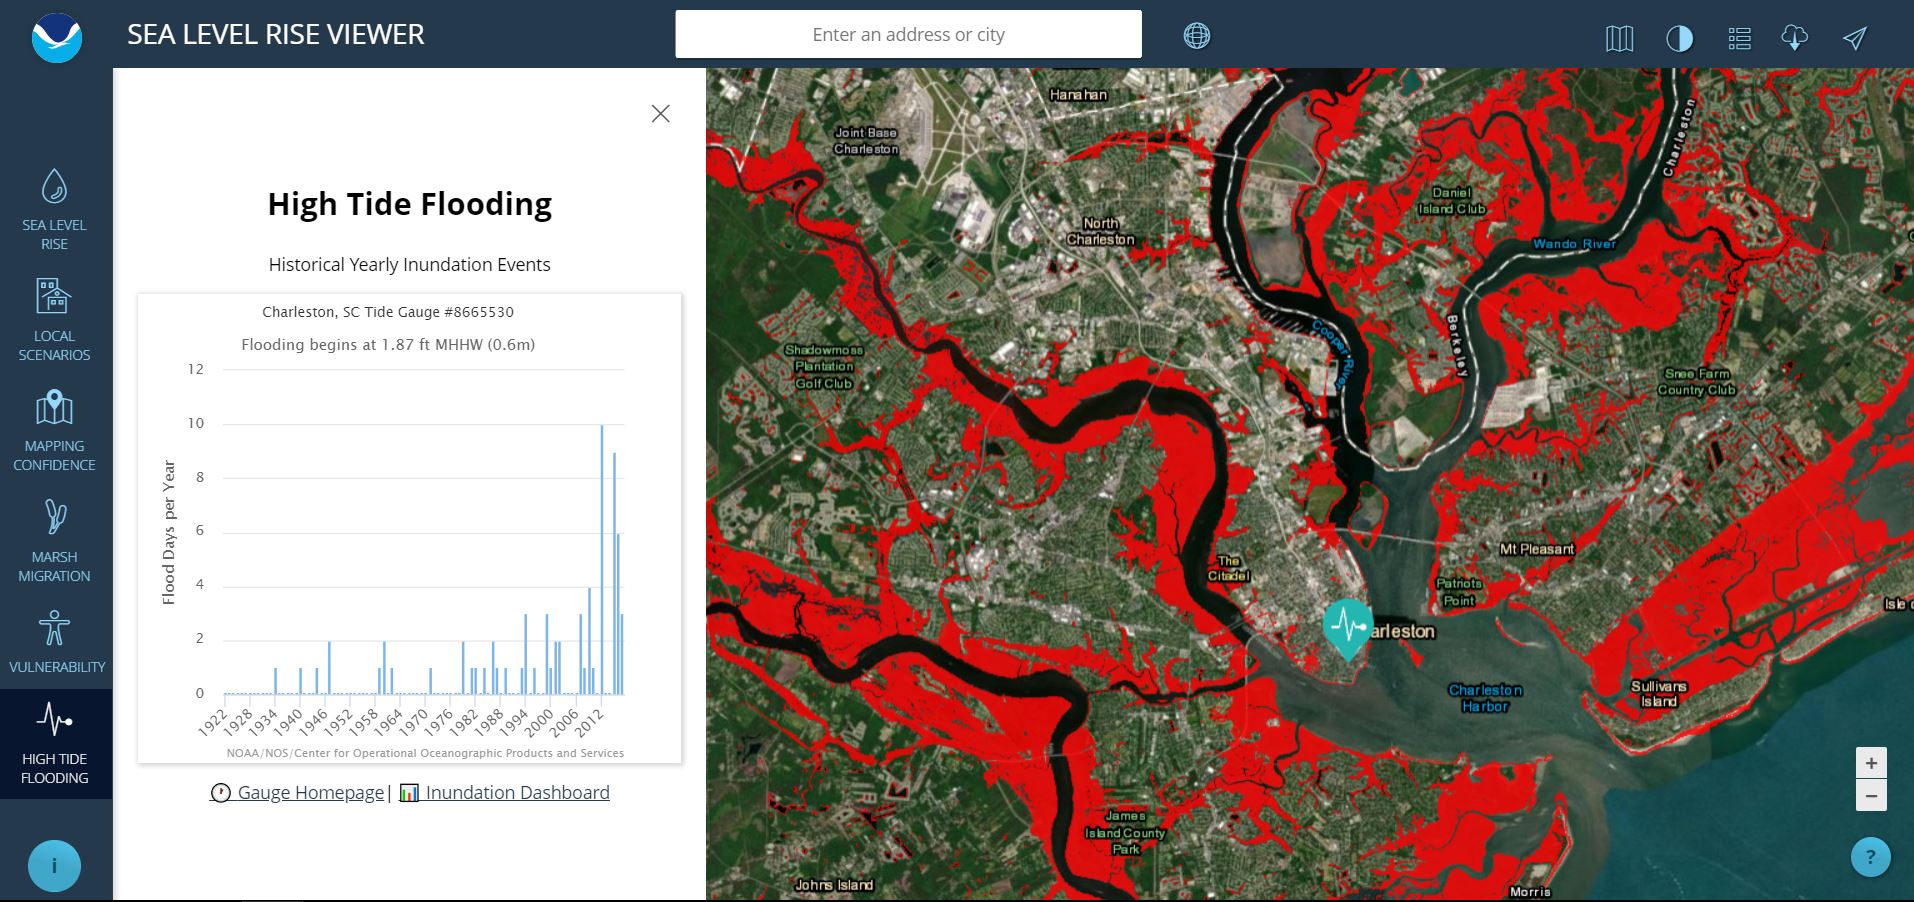
NOAA Center for Operational Oceanographic Products and Services for providing three-year water level analysis for flood frequency content.
The Louisiana Coastal Protection and Restoration Authority (CPRA) and LSU AgCenter provided crucial levee data, as well as review and disclaimer information, for mapping layers in Louisiana
The U.S. Geological Survey provided the base elevation data used to map Louisiana via its Topographic Elevation Model of the Northern Gulf of America.
Special thanks are also extended to the NOAA Digital Coast Partnership for providing comments on the alpha review of the tool. The Nature Conservancy in particular provided helpful input on mapping-confidence methods and marsh migration results.