Overview
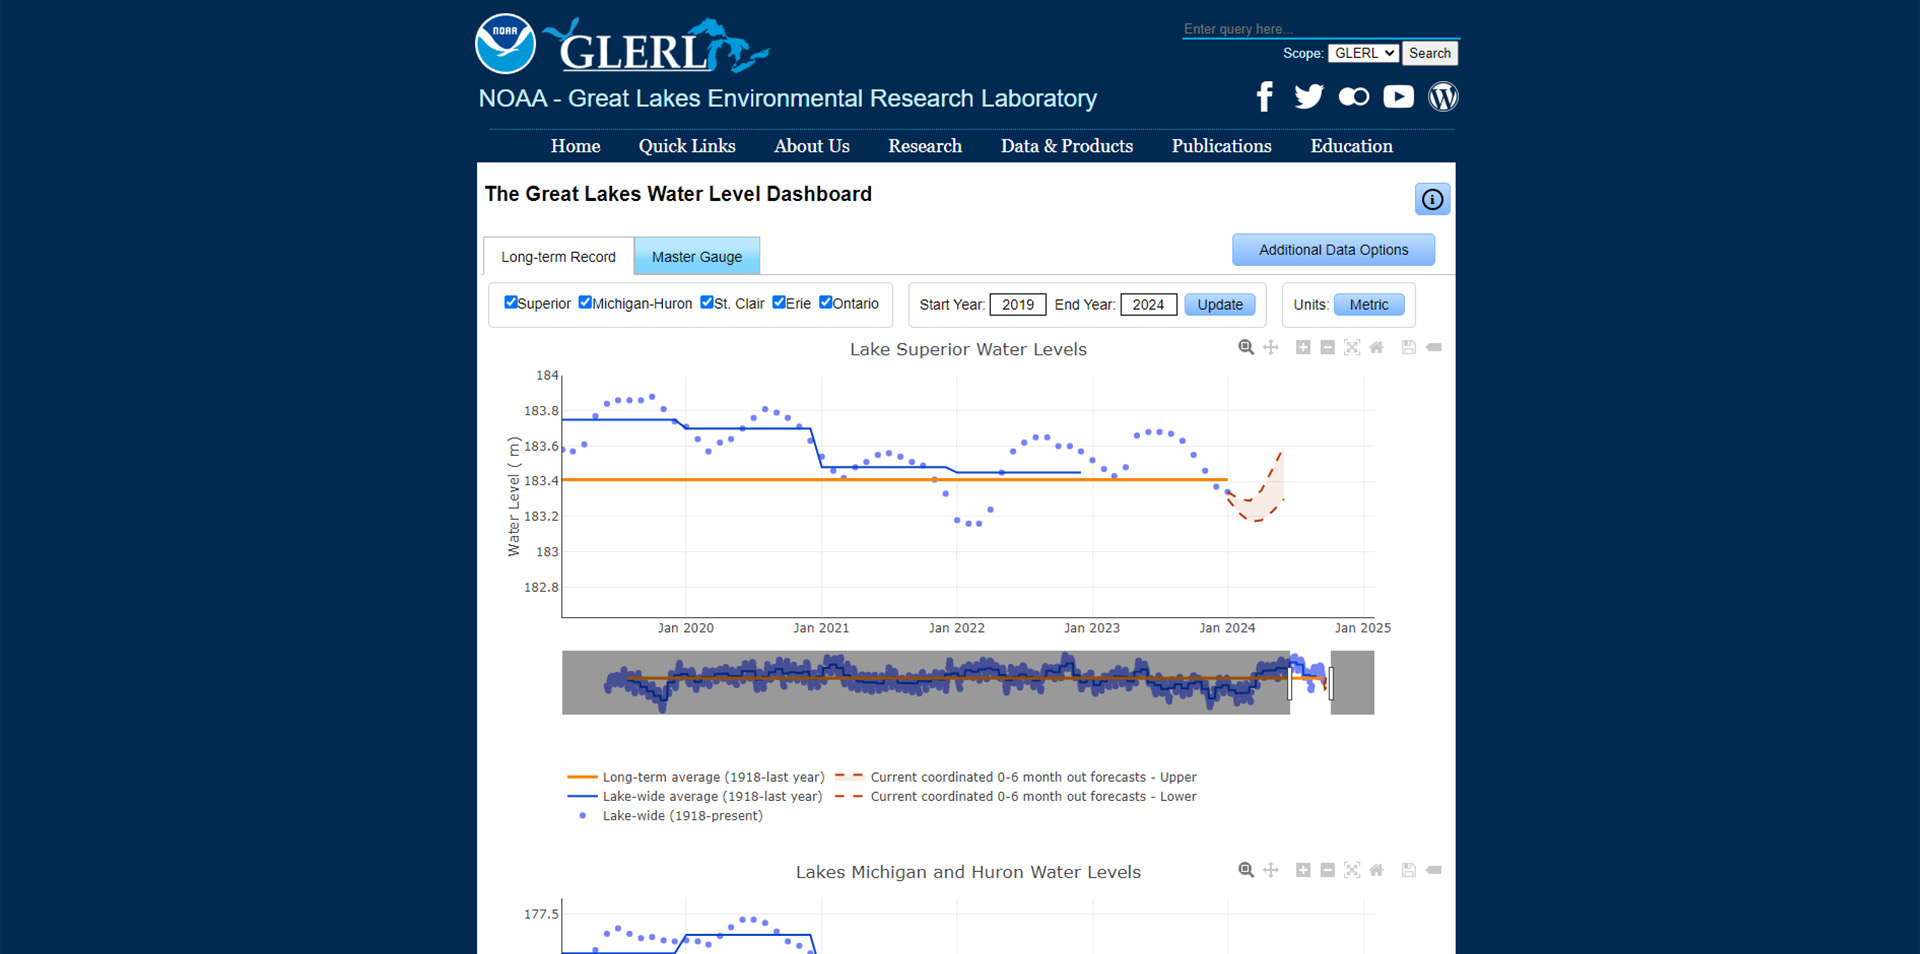
The dashboard was designed to provide access to and visualize monthly Great Lakes water level data and forecasts across a variety of time scales. The tool features a sliding time scale that makes it equally easy to view the past year or the past 150 years.
Features
- Visualize water level fluctuations for the Great Lakes
- Access 150+ years of climatic data and projections
- Access seasonal forecasts
Additional Information
Support
Tool Screenshots